Using Analysis Bands
Analysis Bands let you quickly identify how students did on assignments by color coding their scores in your main grade book window. This article show you how to set up your own analysis bands or use the district provided one.
Updated April 12, 2024 to reflect interface changes coming in fall 2024.
Why Turn On Analysis Bands?
Analysis bands give you a quick visual representation of how your students are doing on their assignments or, for elementary students, standards. Rather than having to look at individual scores, you can see how students generally did by checking the colors on your grade book screen. This lets you quickly identify areas of struggle. The examples below are from an elementary standards based grade book, but analysis bands can be applied to both assignments and standards.
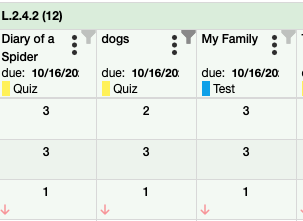
Grade Book With Analysis Bands OFF
Grade Book With Analysis Bands ON
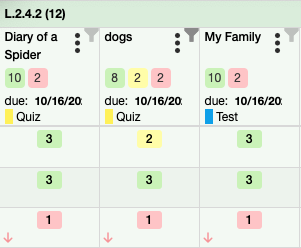
With analysis bands on, you also get a nice breakdown in the header of how many student are in each band.
Turning on Analysis Bands
1. Click the "Options" button
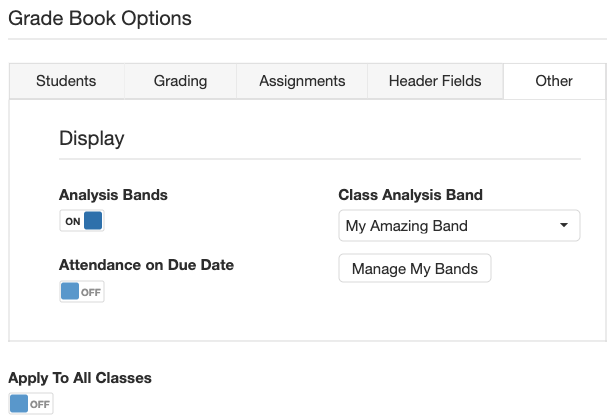
2. In the "other" tab, toggle analysis bands on, and make a selection from the "class analysis band" pulldown menu. To view the cut points for each band, click the "manage my bands" button.
Setting Up Your Own Analysis Bands
1. Open "options" and select the "other" tab as described above.
2. Click "manage my bands" button.
3. Click the blue + button in the lower right corner.

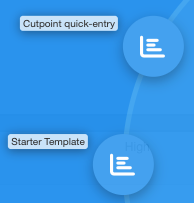
4. This will give you two choices:
-
Cutpoint quick-entry gives you a window where you can enter up to 10 different cut points with names of your choice.
-
Starter Template is a simple band setup with "Low," "Medium," and "High"cut points predefined for you. You can edit both the names and the ranges after the band is created.
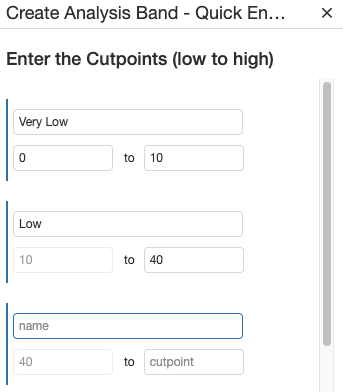
5. For Cutpoint quick-entry, enter the low and high value for the first range you want to define. The cut points can be a percentage (0- 100) or rubric score (0-4, 1-8, etc.). Entering a high value on the first range will automatically populate the low value for the next range.
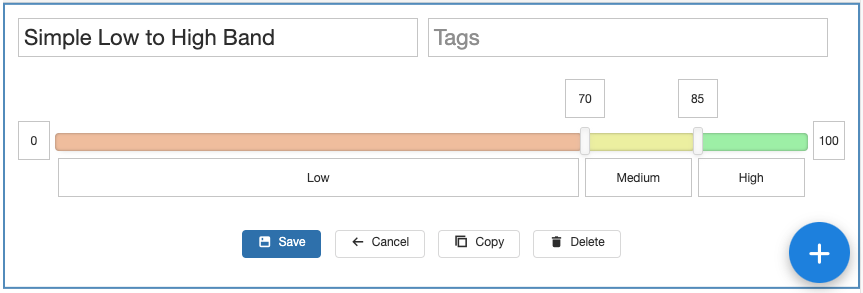
6. Selecting Starter Template will create the default low, medium and high ranges and take you to the screen below where you can edit your band.
Editing Your Analysis Bands
1. Click the  icon for the band you want to edit. You can only edit bands you have created.
2. Give your band a name and use the sliders to adjust the ranges. You can also manually enter the numeric values.
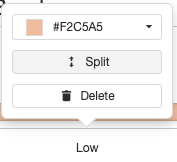
3. Clicking on the range name lets you rename it and also provides options for choosing the color to represent that range, splitting it, or deleting it.
4. Save your changes when complete.
Video Instructions